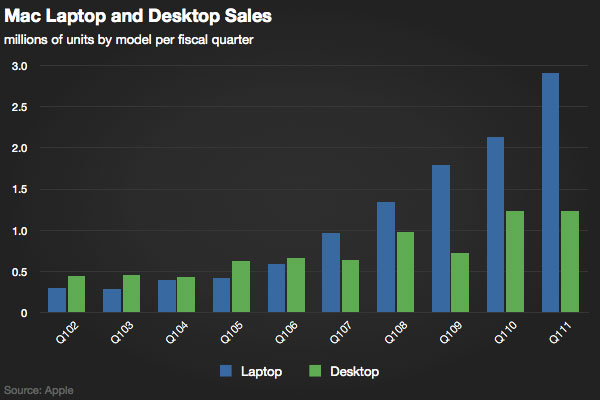
So you’ve probably heard or read about Apple’s gangbusters performance in their Q1 2011 financial results, if not head over here for a full rundown of the data. However for all those that prefer seeing numerical data in graphics or want to truly grasp how significant Apple’s results have been, stick around.
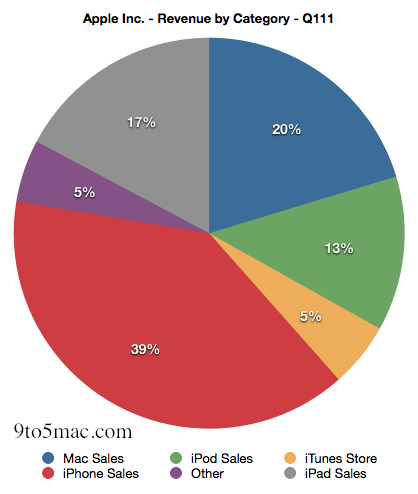
Perhaps one of the most astounding figures is that the iPad accounts for 17% of Apple’s profits despite still being in its first year of sales. Compare this to the iTunes store, which has been operating since 2001 and has been undeniably successful but only holds a 5% share of Apple’s revenue.
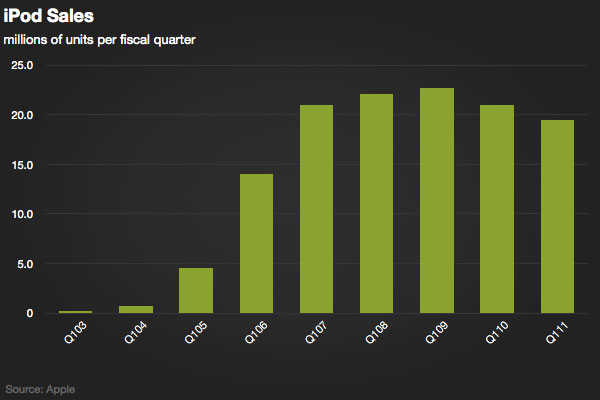
iPod sales seem to have reached market saturation with sales leveling off since Q1 2008 and have slightly decreased in the past two years but sales are still around 20 million per quarter. Also to note is that revenue for the iPod’s grew by a modest 1% in the latest quarter.
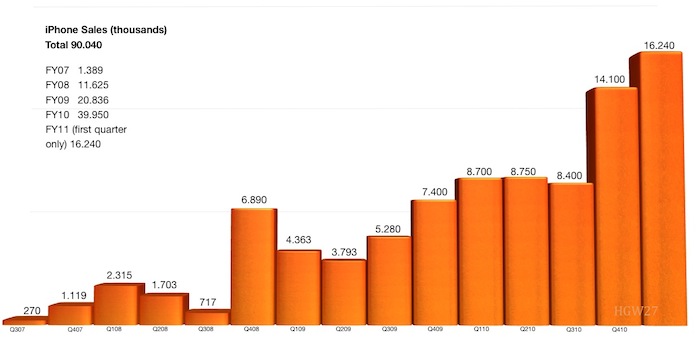
iPhone sales on the other hand are just continuing to boom and grow year over year and quarter to quarter and sales reached a record 16.2 million in Apple’s latest quarter, which year over year is an 86% increase which is a phenomenal increase for a product that launched four years ago.
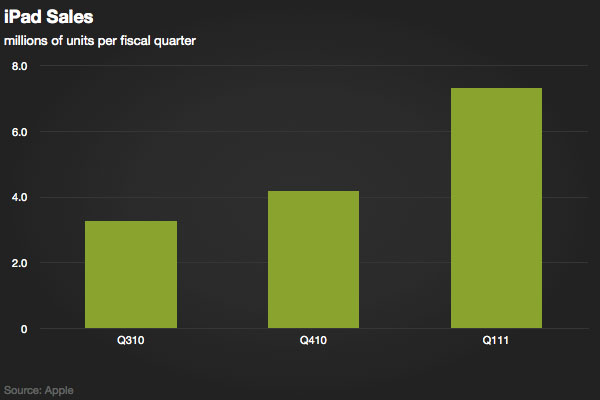
Yet to be a year since the launch of the iPad it nearly doubled in sales between Q4 2010 and Q1 2011, going from 4.19 million sales to 7.33 million sales. No doubt, like iPods, the iPad was highly popular for Christmas presents, making up for such a rapid increase in sales over the quarter.
Despite being outpaced in revenue by the iPad, the Mac still broke a sales record, hitting 4.19 million in the quarter. Desktop sales held fairly steady at 1.2 million sales with only a slight reduction from the previous quarter. Laptops however continued to grow to 2.9 million sales another record-breaking number for Apple, turning laptops into 70% of all Mac sales.
[Graphs via: 9to5 Mac [1], 9to5Mac [2], The Apple Blog]


