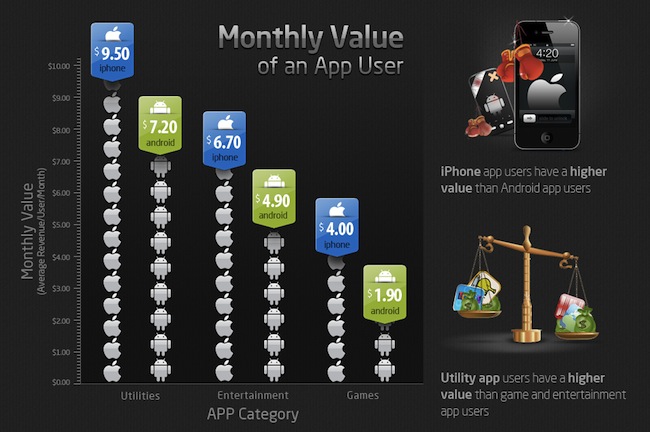
An interesting chart put together by mobile advertising company Mobclix shows that the value of iPhone app users is higher than Android app users. This value has been calculated dividing the average revenue of apps from the Utilities, Games and Entertainment categories by the number of unique users per month. Other criteria used to create this infographic include “active users” (people who launch an app at least 3 times a week and use it for at least 5 minutes) and apps that spent “an average of two weeks in their categories ‘Top 10′ listing and are Free apps”.
As you can see in the image above, apparently the value of iPhone app users is higher. But as noted by TUAW, we have to consider the nature of this chart. First off, the value of the Games category is lower, but only because there are lots more users playing games on the iPhone than doing math with a utility app. Just think about the 200 million minutes spent every day playing Angry Birds. Similarly, we could apply this concept to Android users overall: paid apps struggle to generate great numbers in the Android Market, but it’s not a secret that there are more Android handsets out there than iPhones (basing on the shipment numbers that come out every month from companies like Millenial).
So the question is – are iPhone users really worth more, or does a chart like this simply play well with the revenue and average users from the iOS platform? I believe a little bit of both. Perhaps categories (games) and platforms (Android) with large userbases aren’t really meant for an infographic like this, but there is no doubt the App Store offers developers a more solid source of income than Google’s Market. It’ll be interesting to take another look at this chart a year from now, with several Android tablets on the market and after Google’s rumored efforts to put more focus on paid software.


