Over the past few years, Twitter has created and acquired an impressive array of mobile developer tools that it offers under the umbrella brand of Fabric. Today, Twitter released an iPhone companion app for Fabric that puts two of its most popular tools in your pocket – analytics and crash reporting. I have been testing Fabric, the iOS app, with two iOS apps provided by Twitter for the last few days and I’m impressed with its ability to sift through, organize, and display large quantities of data in an effective and meaningful way on an iPhone.
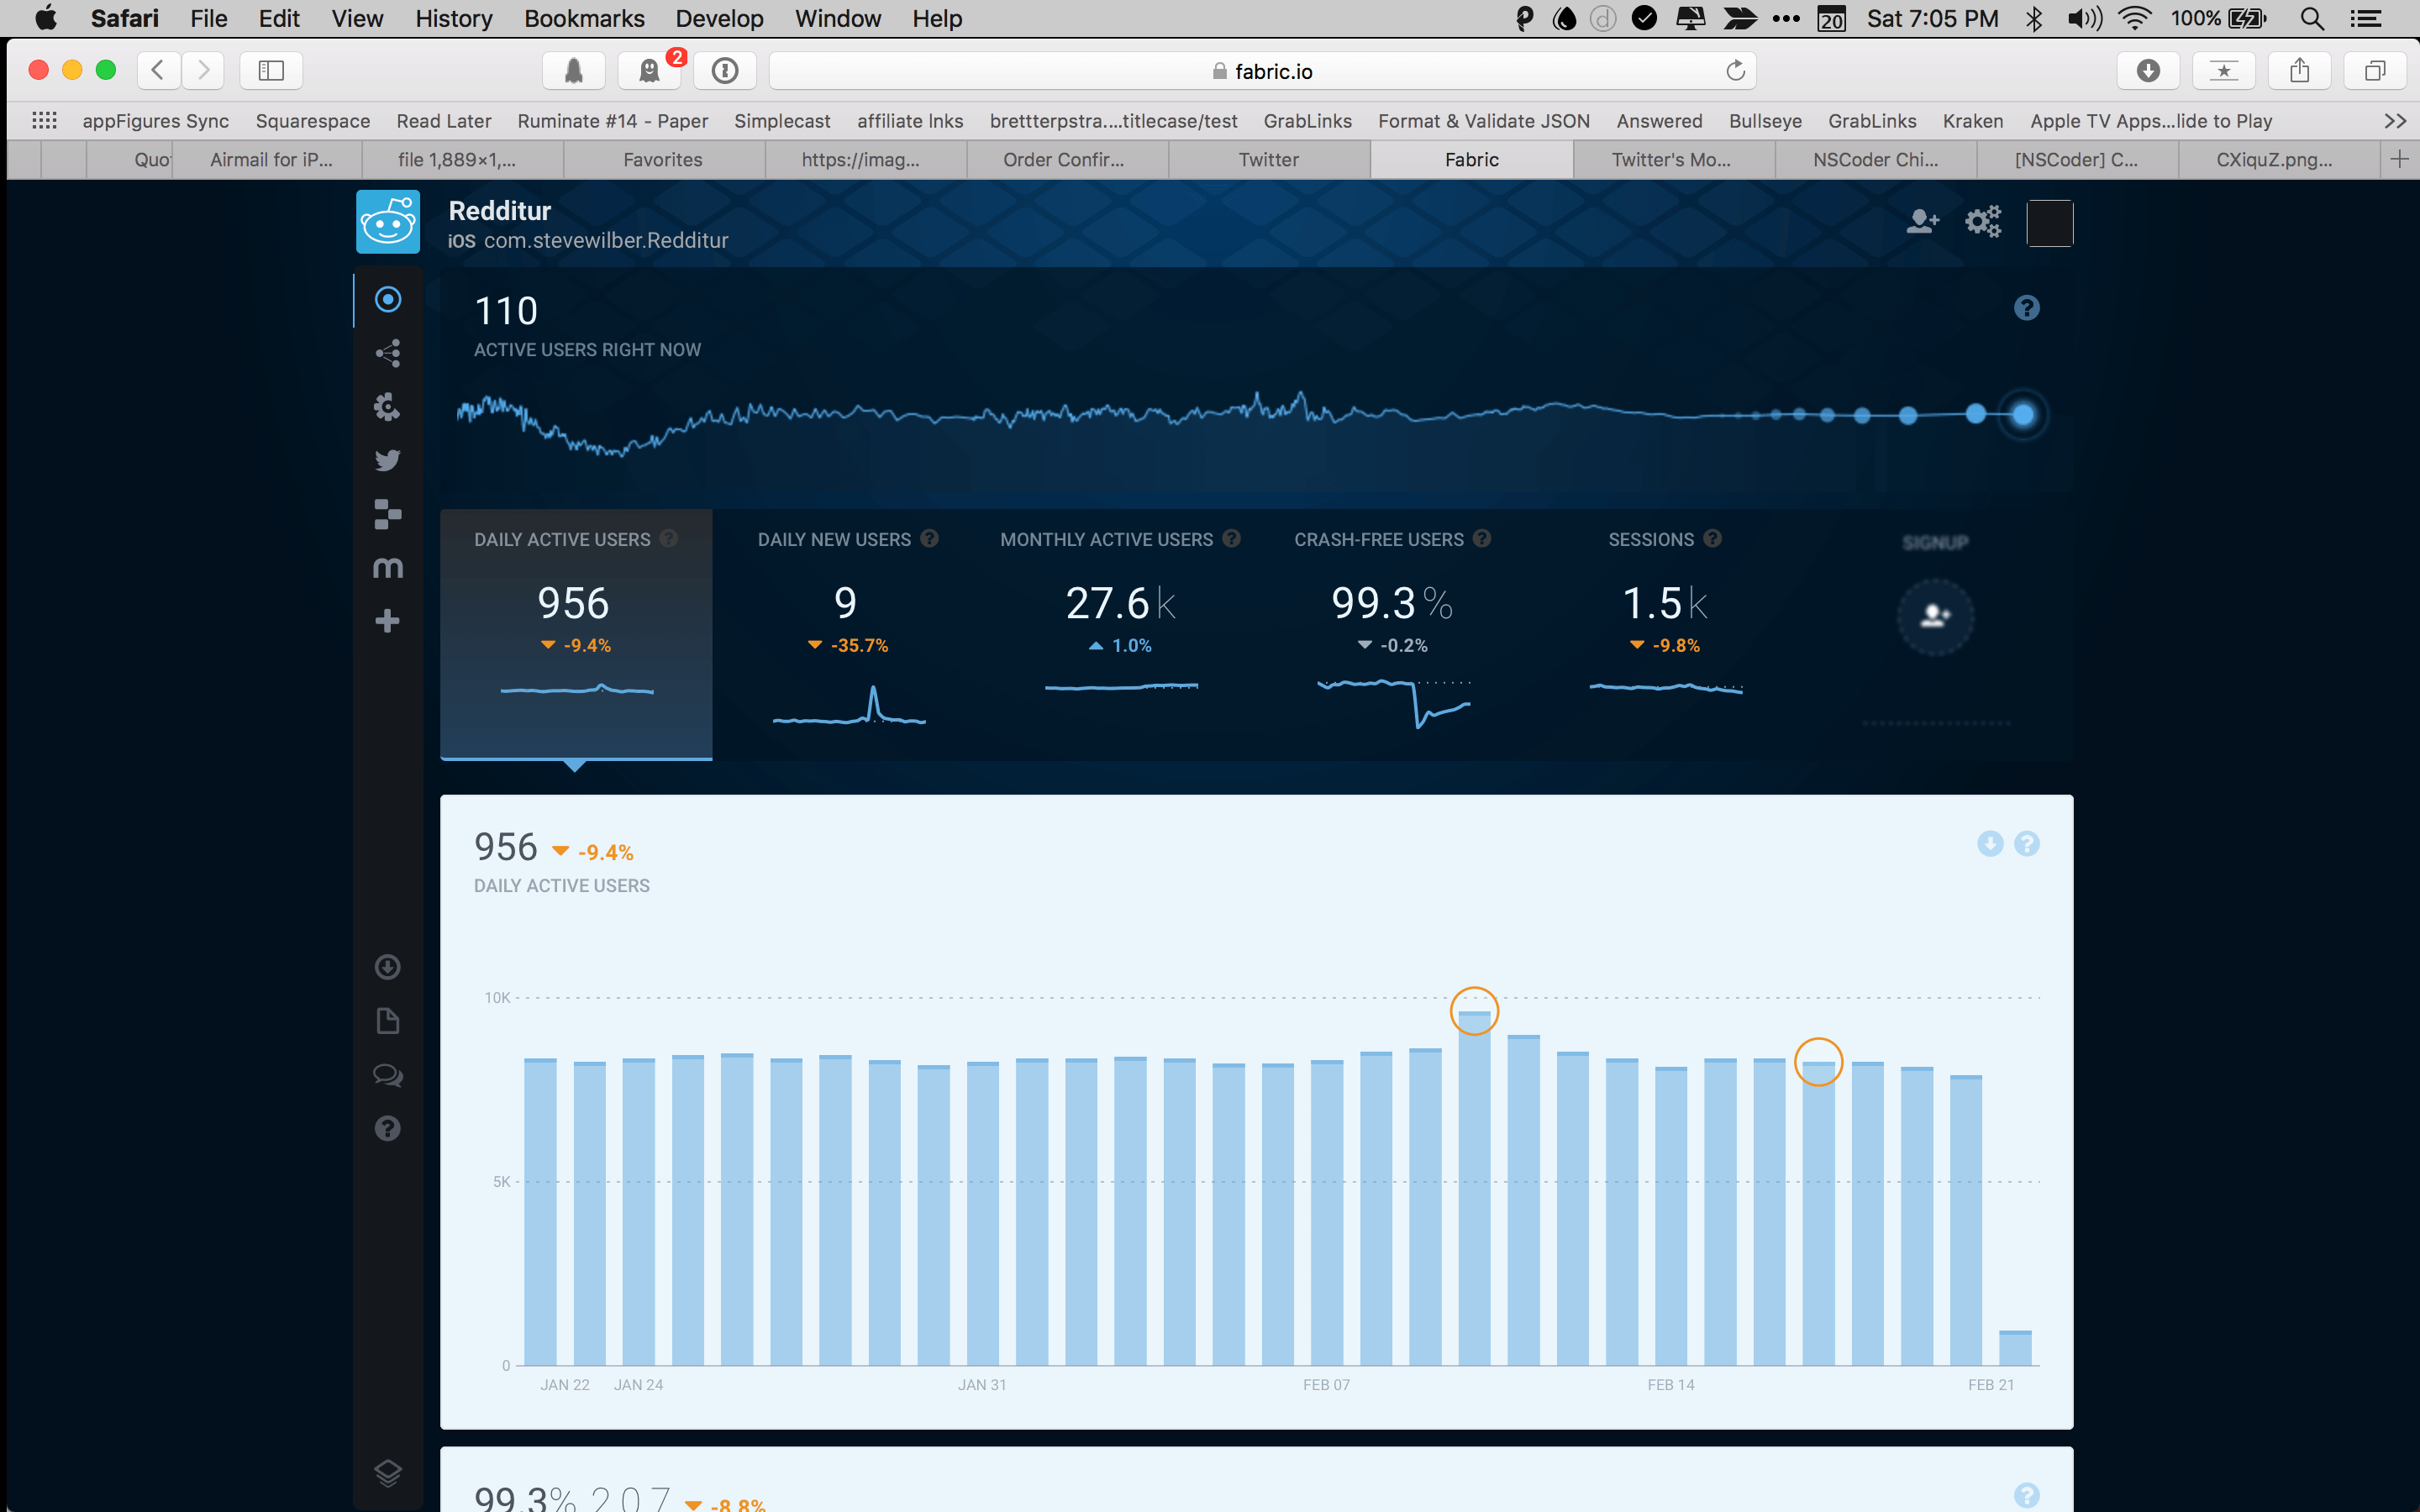
Fabric isn’t one tool. It’s a collection of modular tools that mobile developers can add to their apps that do things like provide analytics, crash reporting, user login systems, and advertising to name a few. At the center of the Fabric services is its dashboard, a well-designed web app that brings together usage data, crash reporting, and other tools in one spot. With the introduction of its Fabric iOS app, Twitter has chosen wisely to bring a subset of the dashboard’s functionality to the iPhone.
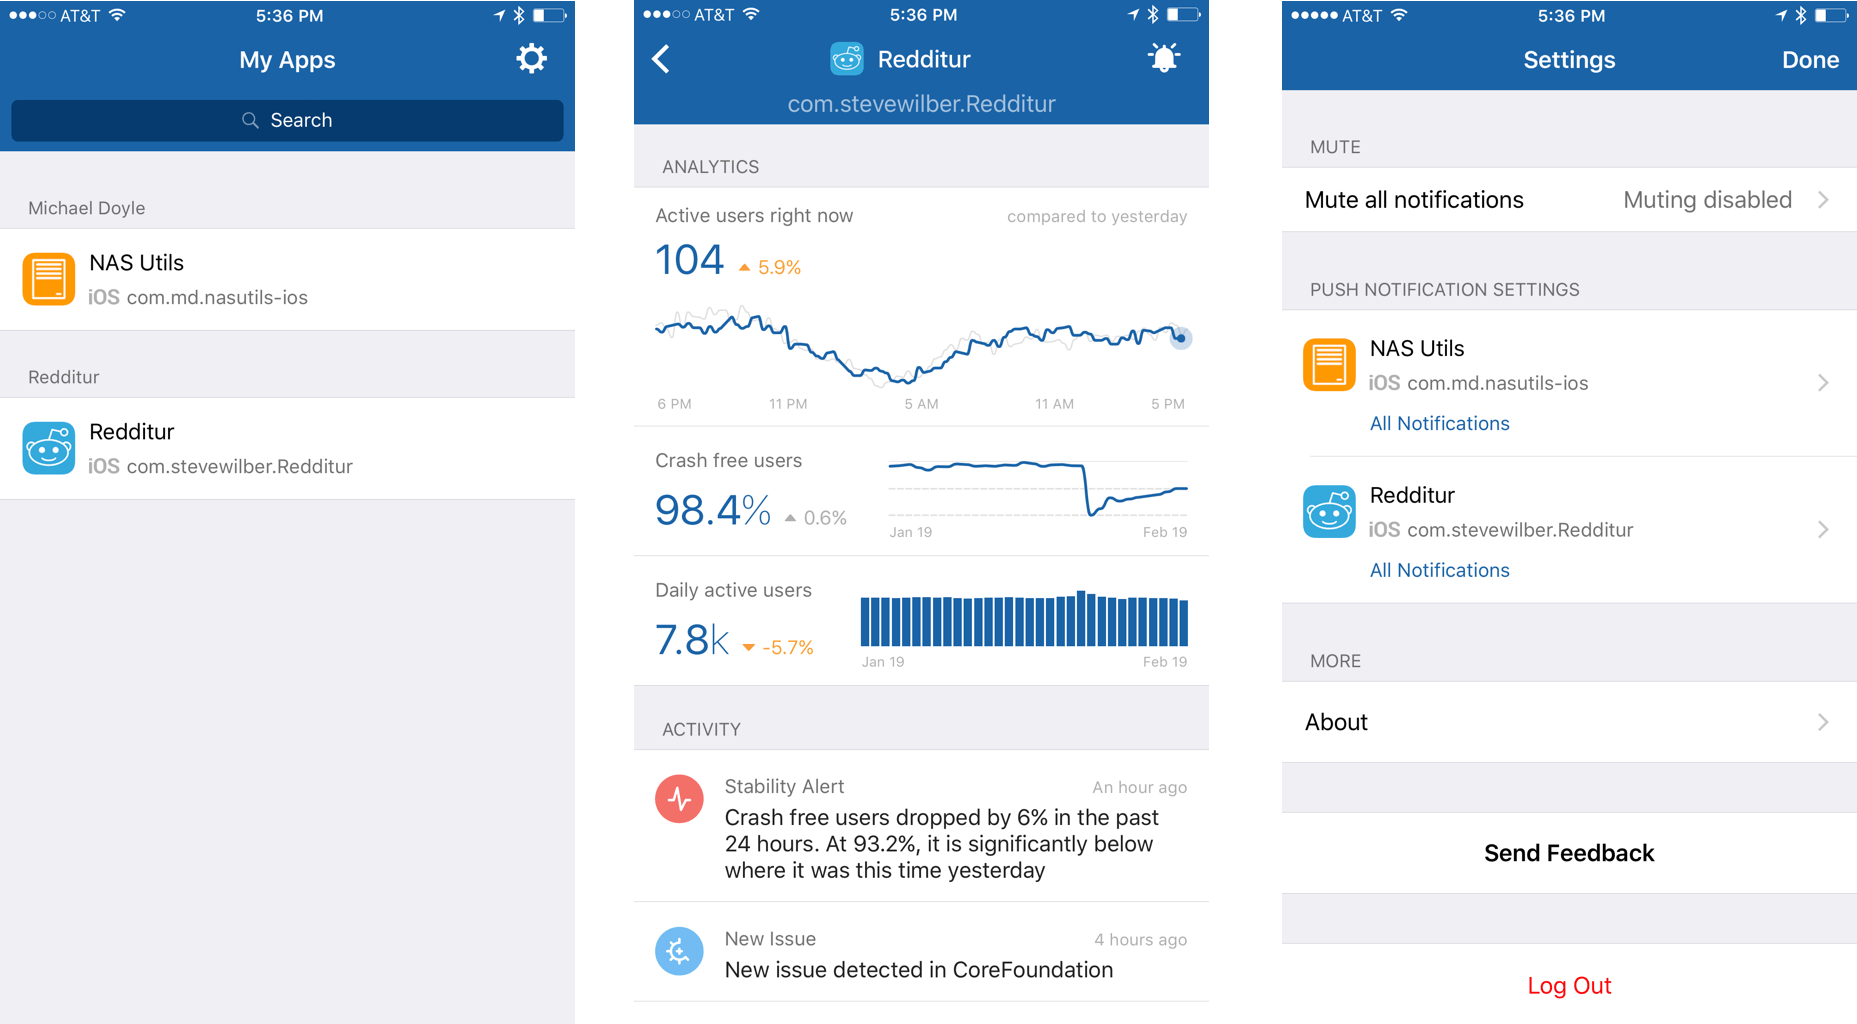
During my tests of Fabric, I monitored usage and crash data for two apps. When you launch Fabric, it opens to the last app you viewed. If you monitor more than one app, you can tap the back button on the left side of the navigation bar to view a list of all your apps.
Picking an app takes you to the dashboard, which has two components: analytics and activity. The Analytics section has three sections that update automatically, though not as frequently as the web app. The first section displays the number of current active users, the percentage change from the day before, and a graph of current users over time overlaid with the graph from the previous day. The second and third sections display the current percentage of crash-free users and number of daily active users, the percentage change from the same day the week prior, and a graph of those metrics during the last 30 days. I got the explanation of the percentage changes for each metric from fabric.io because they are not explained in the app. One nice addition would be a help section in Settings that explains each metric and peek and pop access to the same information on the iPhone 6s.
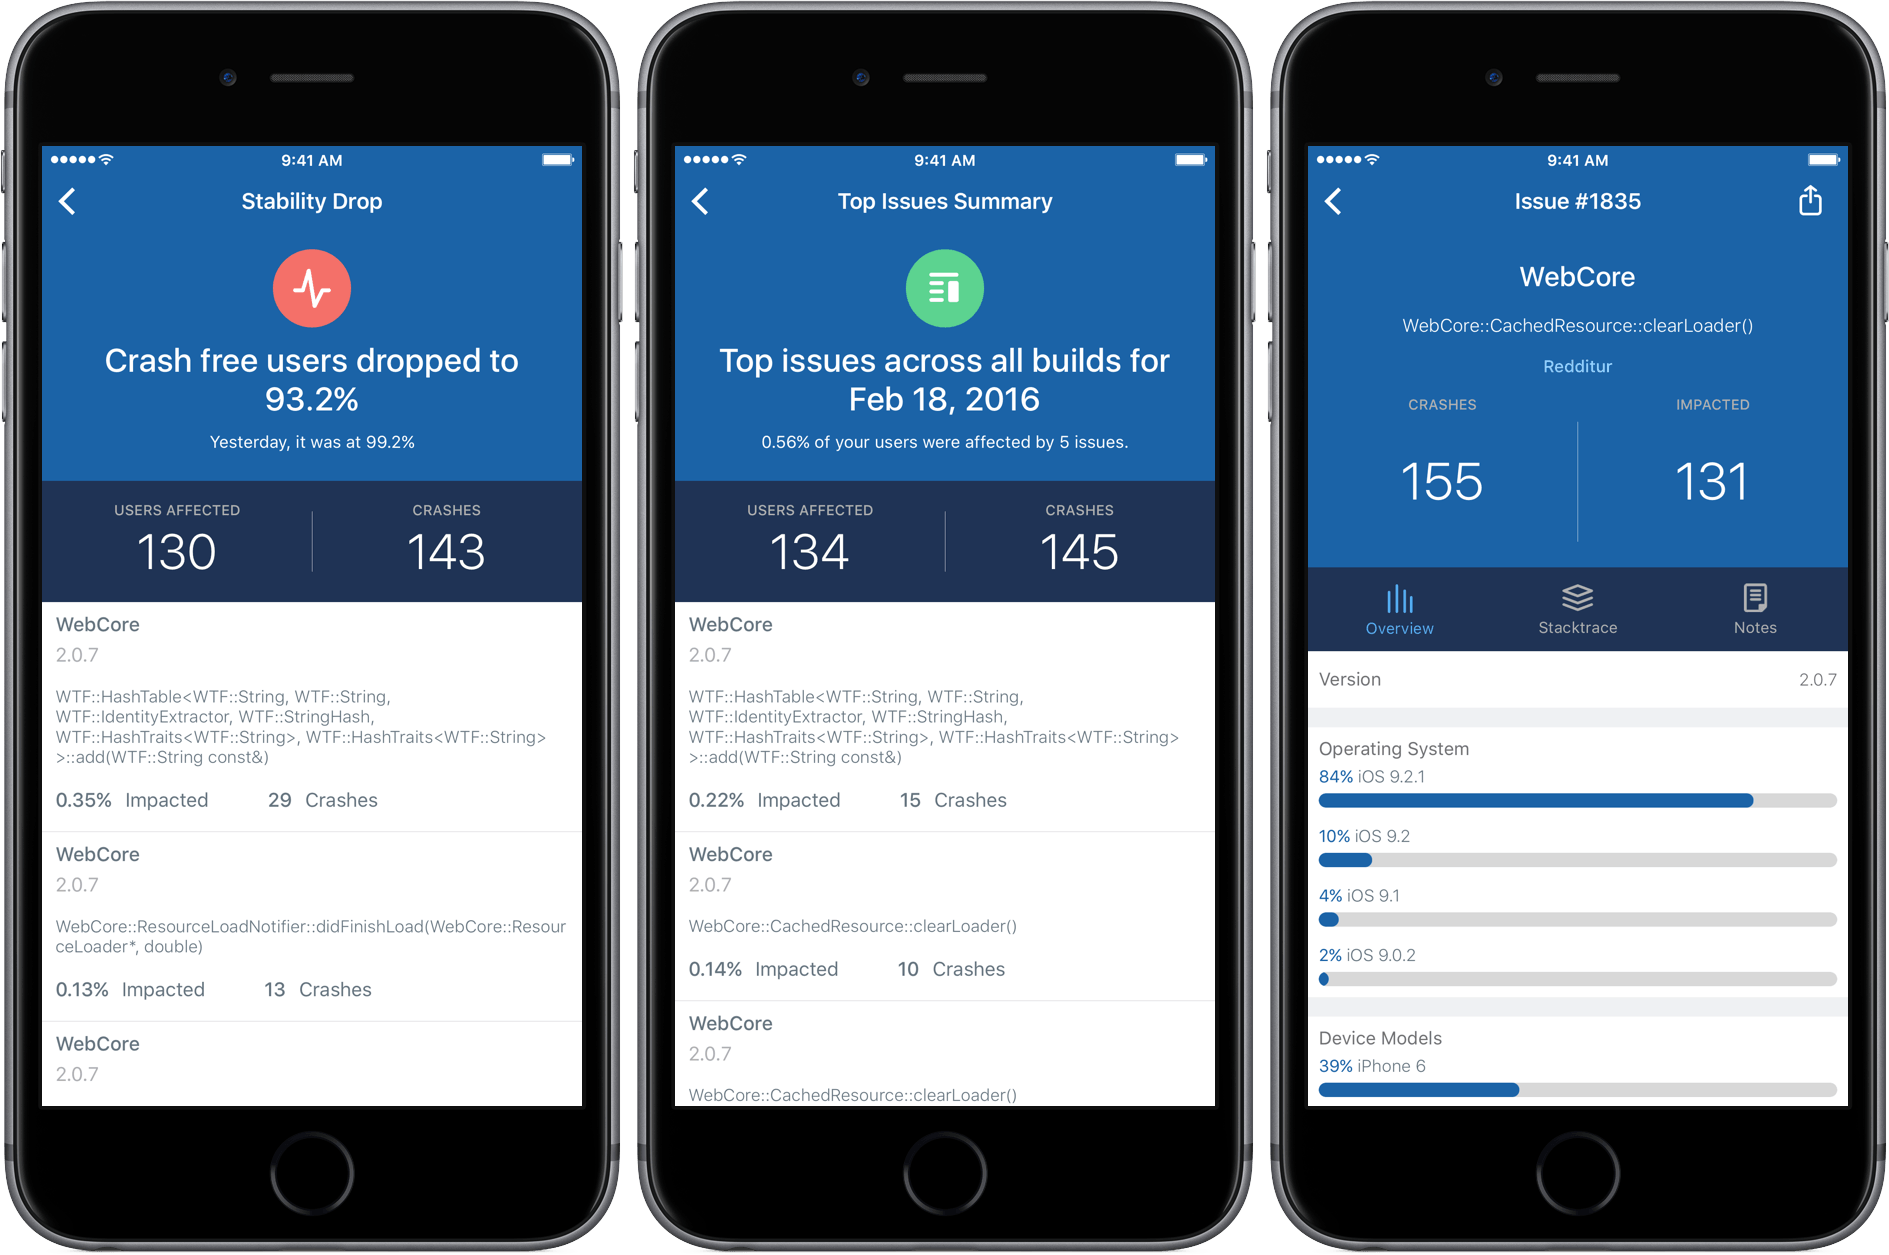
The Activity section of Fabric is a chronological list of events detected in your app. Some entries summarize data collected over time, such as crash trends, while others call out specific new issues. That information alone is useful, but Fabric goes deeper.
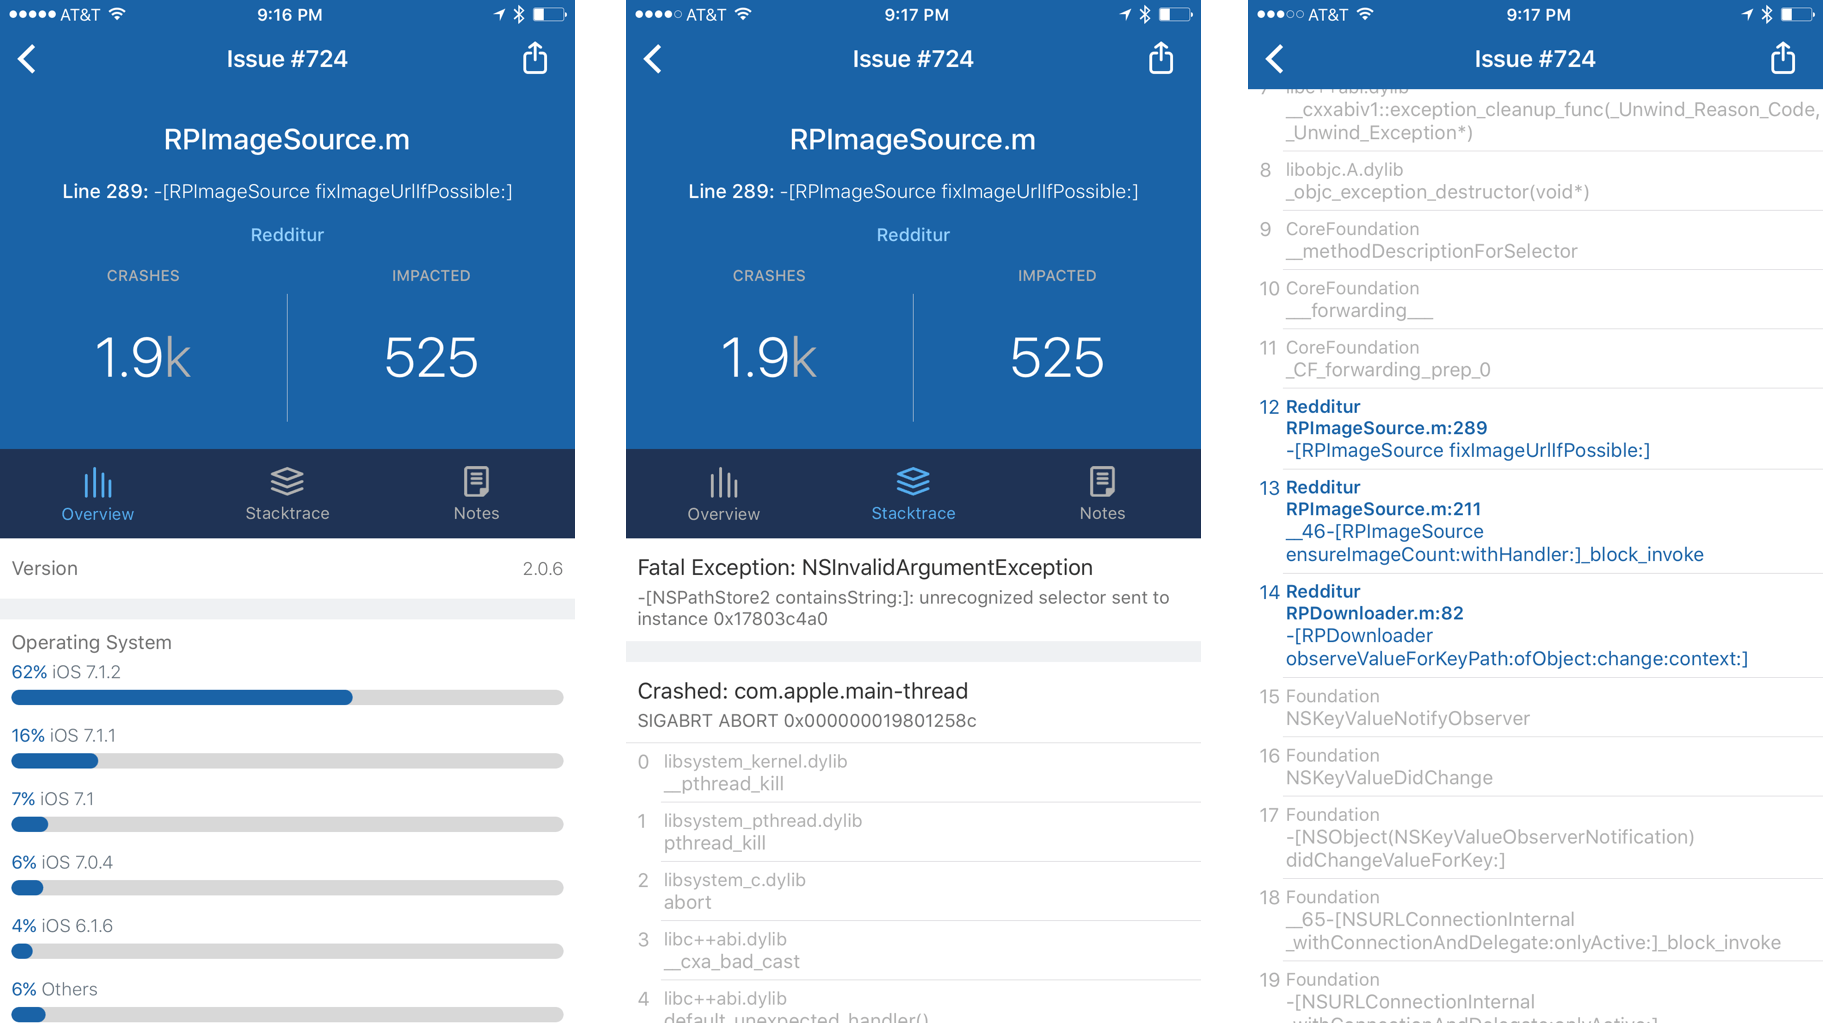
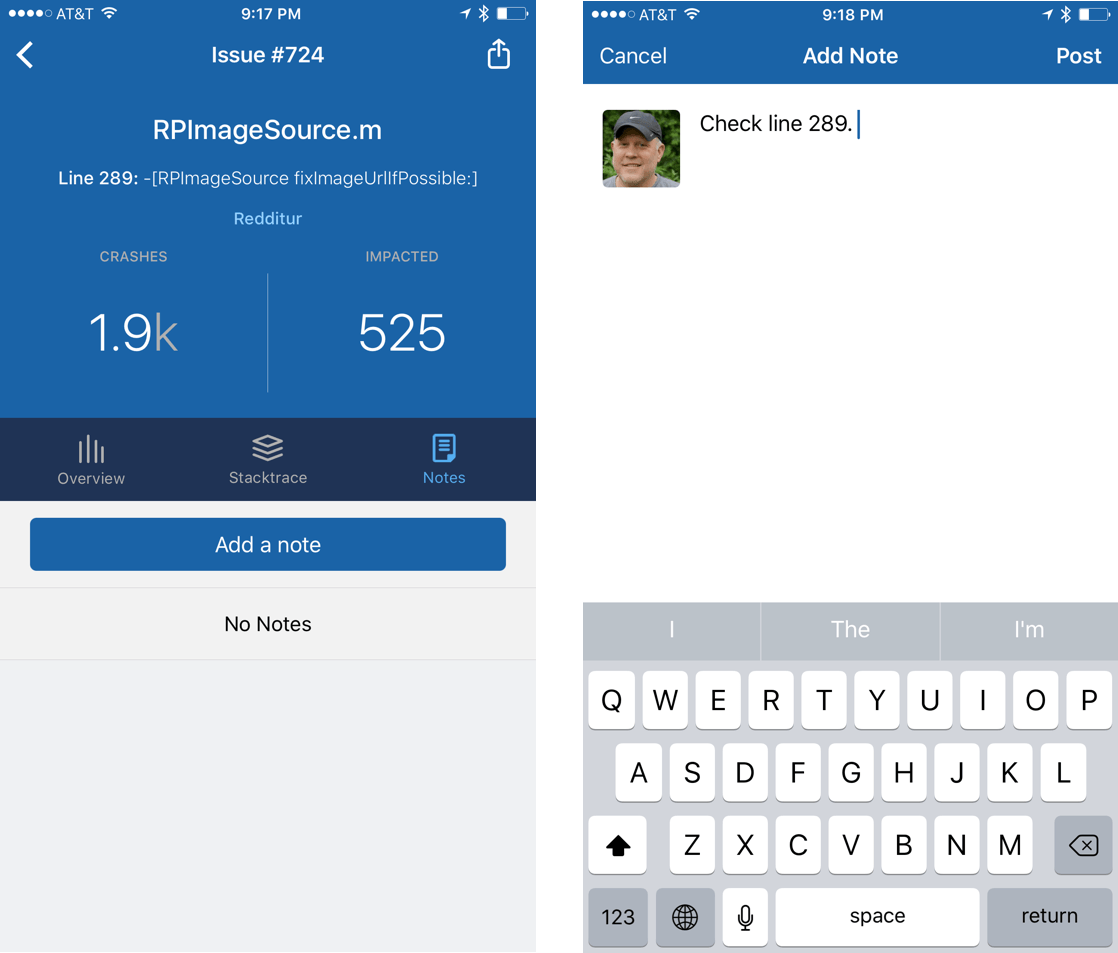
Tap on any of the activity entries and you are taken to a summary of the issue, including device and iOS version. A second tab provides a stack trace to help debug the issue reported, which highlights calls directly related to your app in a bold blue that matches Fabric’s color scheme. The third tab lets you add notes about the issue. There is also a share button that lets you send a link to that specific issue, which is a nice way to pinpoint an issue for a colleague.1
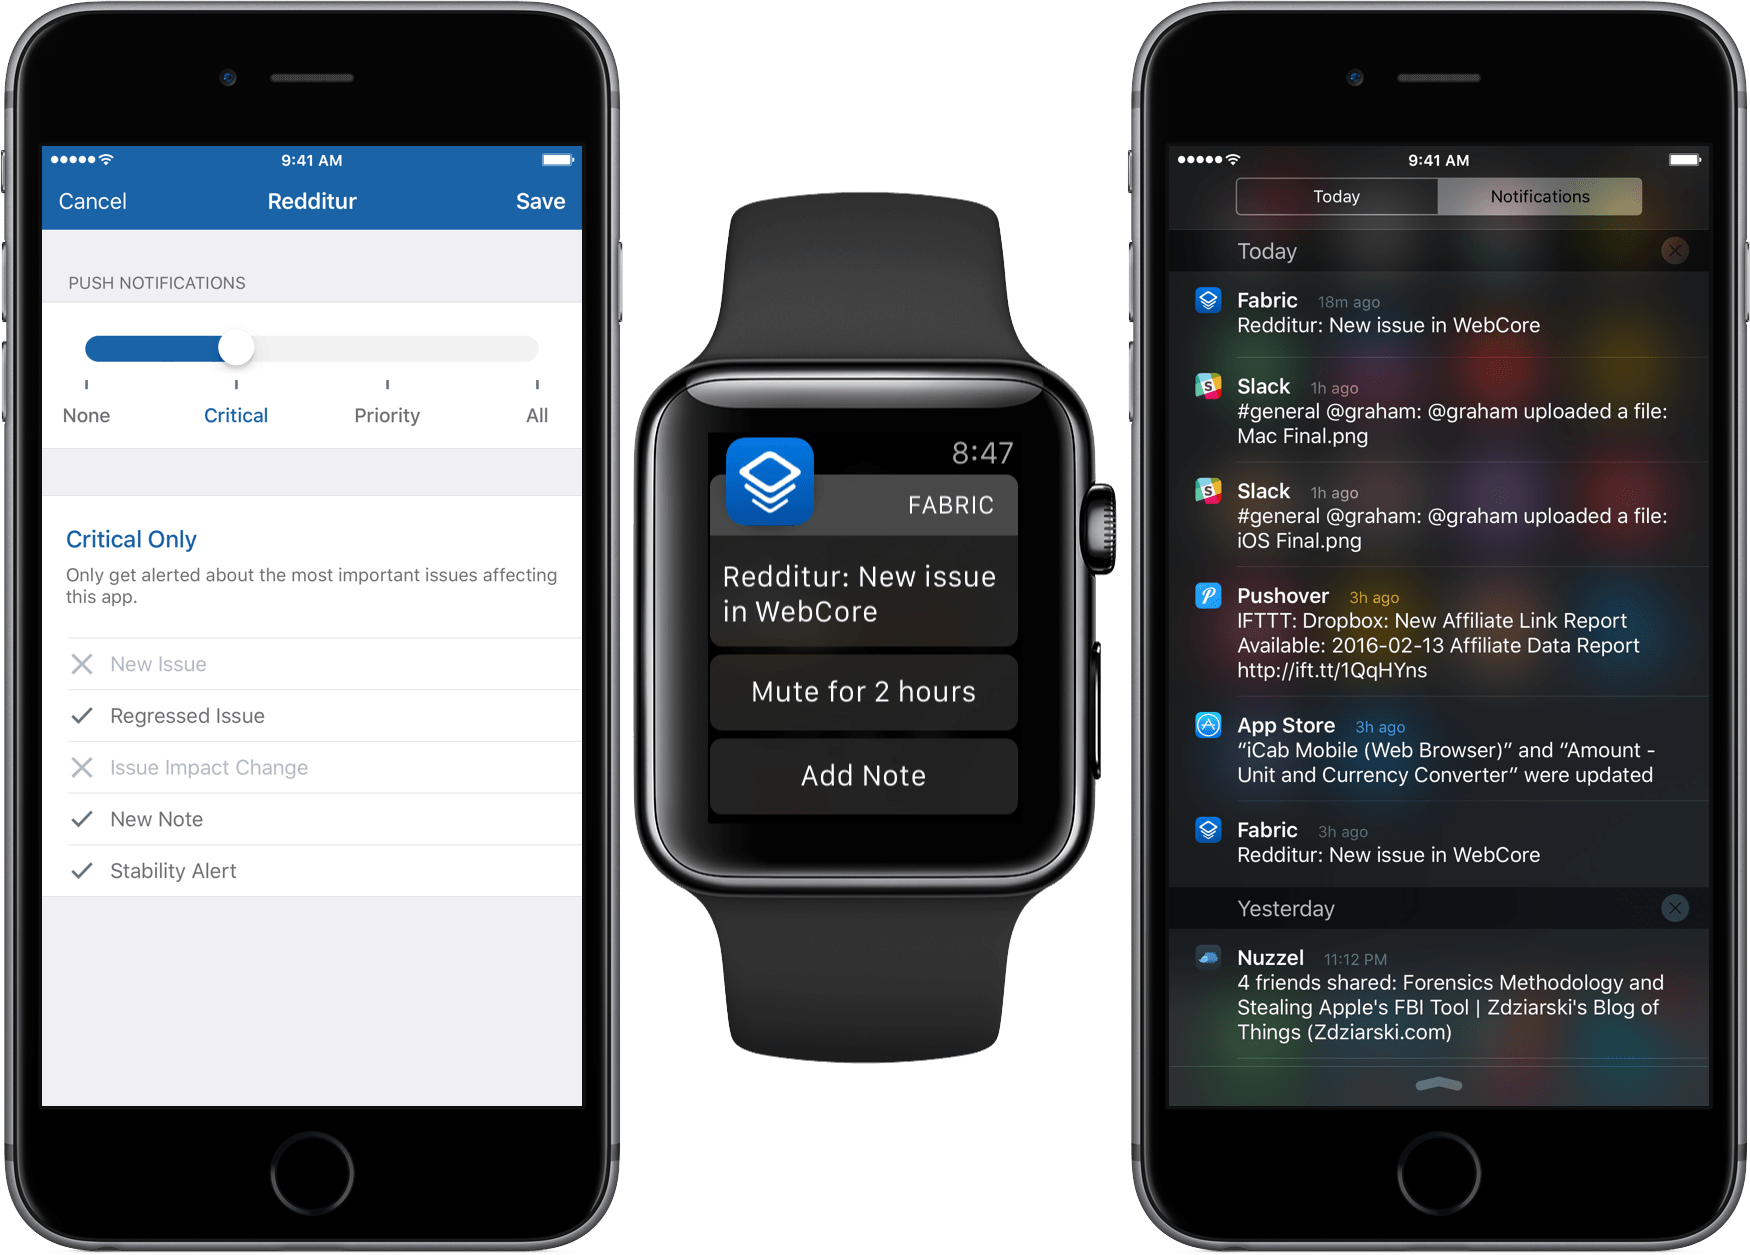
Fabric does a great job with notifications, which can be pegged to any of four settings – ‘None,’ ‘Critical,’ ‘Priority,’ or ‘All.’ The choices are a good way to customize Fabric to suit your needs. Fabric’s alerts use the iOS actionable notification system. Swiping left on an issue notification lets you mute it for two hours or add a note. Because actionable notifications are available on the Apple Watch, the same options are available there too.
The design of fabric.io’s dashboard is one of its greatest strengths. Fabric’s iPhone app builds on that design, which is smart. It’s no small feat to distill the amount of data monitored by Fabric into easily understandable and actionable information that fits on a phone screen. But, while Fabric’s iPhone design is a worthy achievement, it also raises the question: why no iPad app? Fabric works well in Safari on an iPad Pro, but the experience on smaller iPads is inferior, and I would prefer to see a native version of Fabric that takes advantage of the increased space available on the iPad to display additional metrics or more information about each metric.
With its acquisition of Crashlytics in 2013 and rollout of additional developer tools under the Fabric banner, Twitter has demonstrated a dedication to becoming a one-stop shop for iOS developer tools. Extending the already excellent analytics and crash reporting features of Fabric to the iPhone is a welcome addition. Although I wish Fabric was a Universal app, if you already use Fabric, download the iPhone app and give it a try. If you don’t use Fabric, you may want to consider giving it a shot – I know I plan to do so.
Fabric for iPhone is available as a free download on the App Store.
- Remember, project managers, with great power comes great responsibility. Don’t harass your developers with every minor crash report Fabric sends you. ↩︎


